D2I2.
Decoding Disease in India — an interactive, plain-language atlas of what can affect each part of the body: what each disease is, what causes it, and where it hits India hardest. Click any organ to explore. Underneath sits a genomics layer for where Indian DNA differs from the populations medicine was built on.
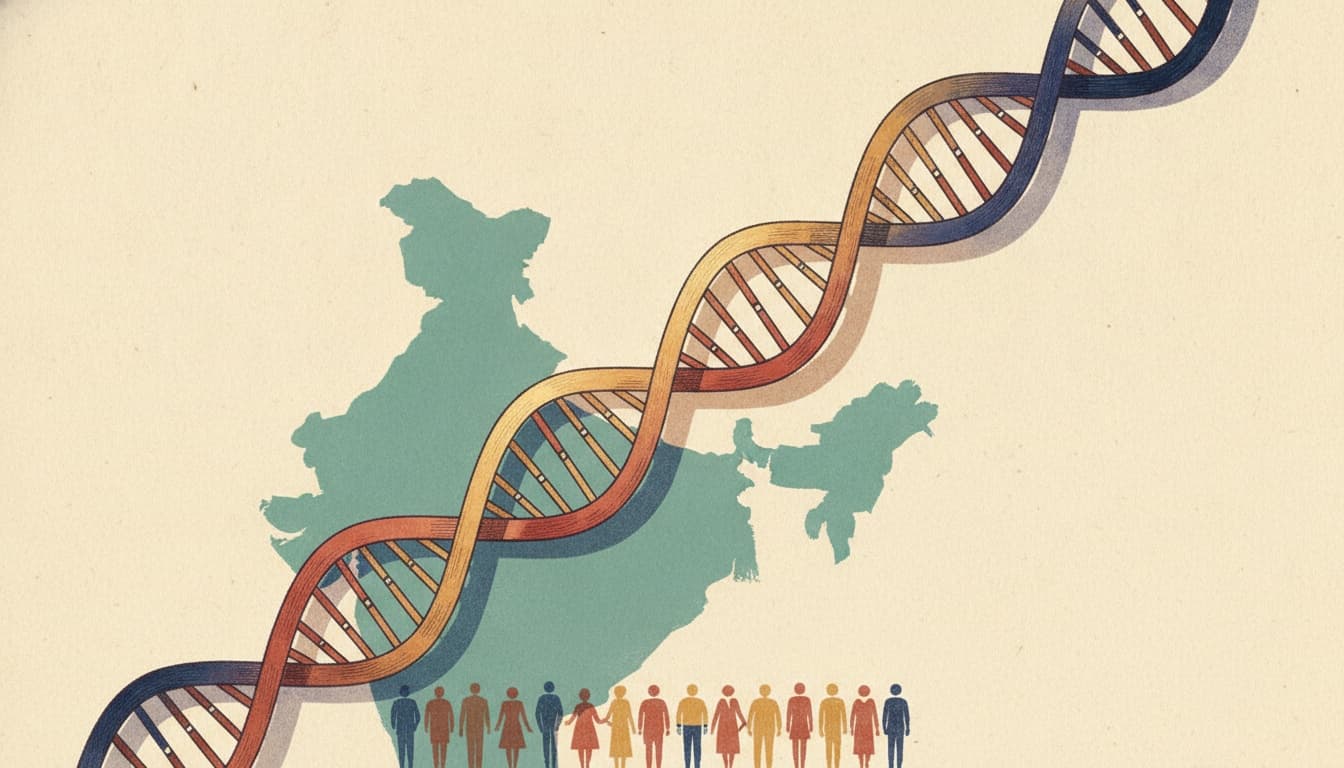
Almost everything medicine knows about your DNA was learned from European bodies.
Fewer than 2%of the people in the world’s genome-wide studies are South Asian — for nearly a quarter of humanity. When a risk model is trained on one ancestry and used on another, its numbers quietly drift. Not because the biology is different — because the calibrationis. Here’s what that drift does, measured on real South Asian genomes.
Diversity figures: Martin et al., Nature Genetics 2019 · Sirugo et al., Cell 2019.
A European-trained for type 2 flags 30.6% of Telugu (India) people as high-risk - vs the 10% it was designed for. That's a 3.1x : the score's 'average' is set to European , so it systematically mis-reads South Asians (a +0.80 SD ).
A risk score that cries wolf: built for European bodies, it over-flags Indians
A is not a risk meter. It is a ranking ruler, and its 'high-risk' mark is painted at the line that catches the top 10% of Europeans, the group it was built on. Apply that same line to Telugu Indians and 30.6% cross it, three times too many (our analysis on South Asian samples). It raises the alarm for nearly one in three people when it was meant for one in ten. That is the crying wolf: too many alarms, not too few.
It is tempting to think 30% is simply correct, since Indians really do get more . That is not why the number is high. The whole South Asian score distribution is shifted to the right because the individual gene sit at different frequencies in different ancestries, an of about +0.80 SD for Telugu. That shift is bookkeeping, not a statement that each flagged person truly carries more risk. When a third of people clear a bar meant for a tenth, the flag stops sorting anyone: you can no longer tell who is genuinely highest-risk. A mis-set ruler, not a sharper one.
India has over 100 million adults with (ICMR-INDIAB national study, 2023), and South Asians develop it younger, at lower BMI, with more hidden belly fat, the '' . A tool that mis-ranks them is not an academic quibble: it mis-triages the largest diabetes population on Earth, sending the wrong people to the front of the queue and missing others.
The is real and measurable. What is missing is a South-Asian-calibrated score against actual Indian outcomes: the shift tells us the ruler is off, but only outcome data can say by how much and in which direction for real risk. The training cohorts barely include Indians, and effect sizes and linkage patterns may differ too, which frequency math alone cannot capture.
PGS000033 on an Indian and (even a few thousand people), set the high-risk threshold on South-Asian rather than European risk, and measure how many people get correctly . A clean, validation once a sample is in hand.
- Martin et al., 'Clinical use of current polygenic risk scores may exacerbate health disparities', Nature Genetics 2019
- Anjana et al. (ICMR-INDIAB), Lancet Diabetes & Endocrinology 2023 - ~101M Indians with diabetes
- D2I2 PRS-transferability analysis (1000 Genomes phase 3)
A European-trained for disease places only 0.7% of Sri Lankan Tamil people above its high-risk cut-off - far BELOW the 10% it was calibrated to. Yet South Asians carry a well-documented EXCESS of real-world heart disease. The score is blind to South-Asian coronary artery disease : it under-warns exactly the group at higher true risk. This under-flagging is more dangerous than over-flagging.
The score that under-warns the very people most likely to have an early heart attack
For disease, the European score places only 0.7% of Sri Lankan Tamils above its high-risk line — far BELOW the 10% design target (our analysis). It under-flags. Yet South Asians have among the highest real-world coronary rates in the world, often a decade earlier than Europeans.
The 'South Asian paradox' — high disease at relatively low and BMI — is long documented (INTERHEART and others). A score that quietly reassures exactly this group is the most dangerous failure mode: false comfort for those at highest true risk.
The downward shift is measurable, and part of the biology is understood ((a), central adiposity, resistance). What's missing is a South-Asian score that recovers the high-risk fraction the European one drops.
Build or a South-Asian score against Indian cohorts and show it recovers the missing high-risk group — turning a falsely-reassuring number into an actionable one.
- Martin et al., Nature Genetics 2019 (PRS transferability)
- Yusuf et al. (INTERHEART), Lancet 2004 — South Asian coronary risk
- D2I2 PRS-transferability analysis (1000 Genomes phase 3)
The frontier: 22 diseases where a South-Asian genomics study would matter most
Ranked by India burden × how mis-calibrated or unstudied South Asians are × whether a genomic handle even exists. These are the tractable ones — where you could actually design the study.
And for 276diseases that hit India hardest, we don’t even have a basic count.
No verified India incidence figure. No genomic handle yet. This is the quieter gap — the diseases of poverty and nutrition where the data simply hasn’t been gathered. You can’t close a gap you haven’t measured.
D2I2 is a decade-long project to map, and then close, this blind spot for India — one disease at a time.
Browse every disease by body system
1648 diseases across 22 systems, each in plain language with the ones that hit India hardest flagged.